
Simplifying K-Means Clustering: A Beginner's Guide to Unsupervised Learning

This is another article in our Unsupervised Learning series. Today, we’ll explore one of the most popular and intuitive algorithms used in unsupervised learning — K-Means Clustering.
Before jumping into K-Means, let’s quickly recall what unsupervised learning means.
In unsupervised learning, we do not have labels or a target column. The data is raw and unorganized. Our goal is to discover hidden patterns, group similar data points, and bring structure to the data.
One of the most common ways to do this is through clustering, and K-Means is the most widely used clustering algorithm.
What is K-Means Clustering?

K-Means clustering is an unsupervised learning algorithm that groups unlabeled data points into K clusters based on similarity.
Here:
K represents the number of clusters (groups)
Each cluster contains similar data points
Data points in different clusters are as different as possible
Example intuition: If you have customer sales data and choose K = 3, the algorithm will divide customers into 3 distinct groups based on their behavior or purchase patterns.
“K-Means” & the Idea?
K → Number of clusters you want
Means → Each cluster is represented by the mean (average) of its data points, called the centroid
So, K-Means works by:
Grouping data points around K centroids such that each point is closest to its assigned centroid.
The main objective of K-Means is to:
Minimize the total distance between each data point and its assigned cluster centroid
This distance is usually calculated using Euclidean Distance.which measures how far two points are from each other in space — similar to measuring distance using a ruler.
How K-Means Algorithm Works (Step-by-Step)
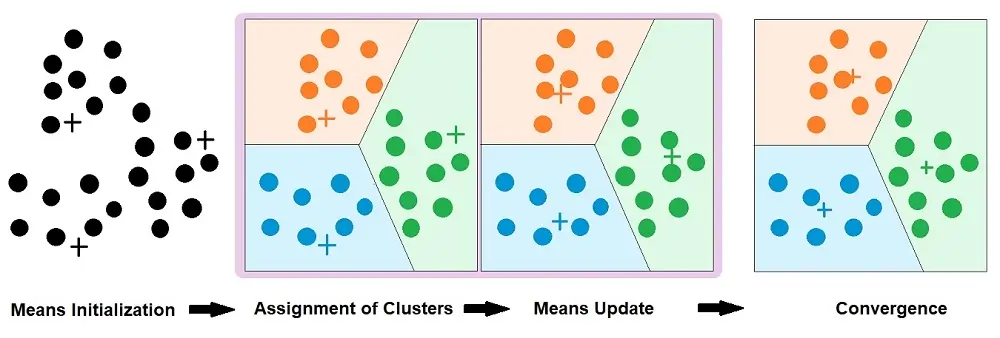
K-Means is an iterative, centroid-based algorithm. It works in the following steps:
Step 1: Choose the Number of Clusters (K) : You decide how many groups you want your data to be divided into. For example: K = 2 → 2 cluster or k=3 → 3 clusters.
Step 2: Initialize Centroids: The algorithm randomly selects K points from the dataset as the initial cluster centroids.
Step 3: Assign Data Points to Nearest Centroid: Each data point is assigned to the cluster whose centroid is closest, based on Euclidean distance.
Step 4: Update Centroids: For each cluster, the centroid is recalculated by taking the mean of all points in that cluster.
Step 5: Repeat (Iterative Process): Steps 3 and 4 are repeated until:
Centroids no longer change, or
A maximum number of iterations is reached
At this point, the algorithm converges and final clusters are formed.
Choosing the Right Value of K (Elbow Method) - Choosing the correct number of clusters is very important for meaningful results.
The Elbow Method is a graphical technique used to find the optimal value of K.
Why Use K-Means Clustering?
K-Means is widely used because it is:
Simple to understand
Easy to implement
Efficient for large datasets
Fast and scalable
Common Applications of K-Means
1. Customer Segmentation: Businesses divide customers into groups based on different behaviours. This helps in targeted marketing and personalized recommendations.
2. Document Clustering: In NLP, K-Means groups similar documents together, such as News categorization, Topic discovery, and Recommendation systems
3. Image Segmentation & Compression: K-Means groups similar pixels together to: Reduce image size (compression)and Identify boundaries in medical or computer vision images
4. Anomaly Detection: Data points far away from any cluster may represent fraud, errors and outliers
5. Organizing Large Datasets: K-Means helps structure raw, unorganized data into meaningful groups, making analysis easier.
Practical Mini Example : K-Means on Iris Dataset (Unsupervised)
We’ll use the Iris dataset (real-world, built into scikit-learn). Even though it has labels, we will NOT use them — because K-Means is unsupervised.
# import librares & load dataset

from sklearn.datasets import load_iris
from sklearn.cluster import KMeans
import matplotlib.pyplot as plt

iris = load_iris()
X = iris.data  # unlabeled features

# selecting features
# Use petal length and petal width (features 2 and 3)
X_selected = X[:, 2:4]


# apply k-means
kmeans = KMeans(n_clusters=3, random_state=42)
labels = kmeans.fit_predict(X_selected)
centroids = kmeans.cluster_centers_

# visualizing clusters
plt.figure(figsize=(8, 6))

plt.scatter(
    X_selected[:, 0],
    X_selected[:, 1],
    c=labels,
    alpha=0.7
)

plt.scatter(
    centroids[:, 0],
    centroids[:, 1],
    marker='X',
    s=250
)

plt.xlabel("Petal Length")
plt.ylabel("Petal Width")
plt.title("K-Means Clustering (Petal Features Only)")
plt.show()

Final Thoughts
K-Means is often the first clustering algorithm people learn, and for good reason. It provides an excellent foundation for understanding:
Unsupervised learning
Data grouping
Distance-based algorithms
If you understand K-Means, learning advanced clustering methods becomes much easier.Follow us along in this amazing journey by ML Diaries by Fahad


